Learning Outcomes
Real, job-ready skills you'll walk away with after this course.
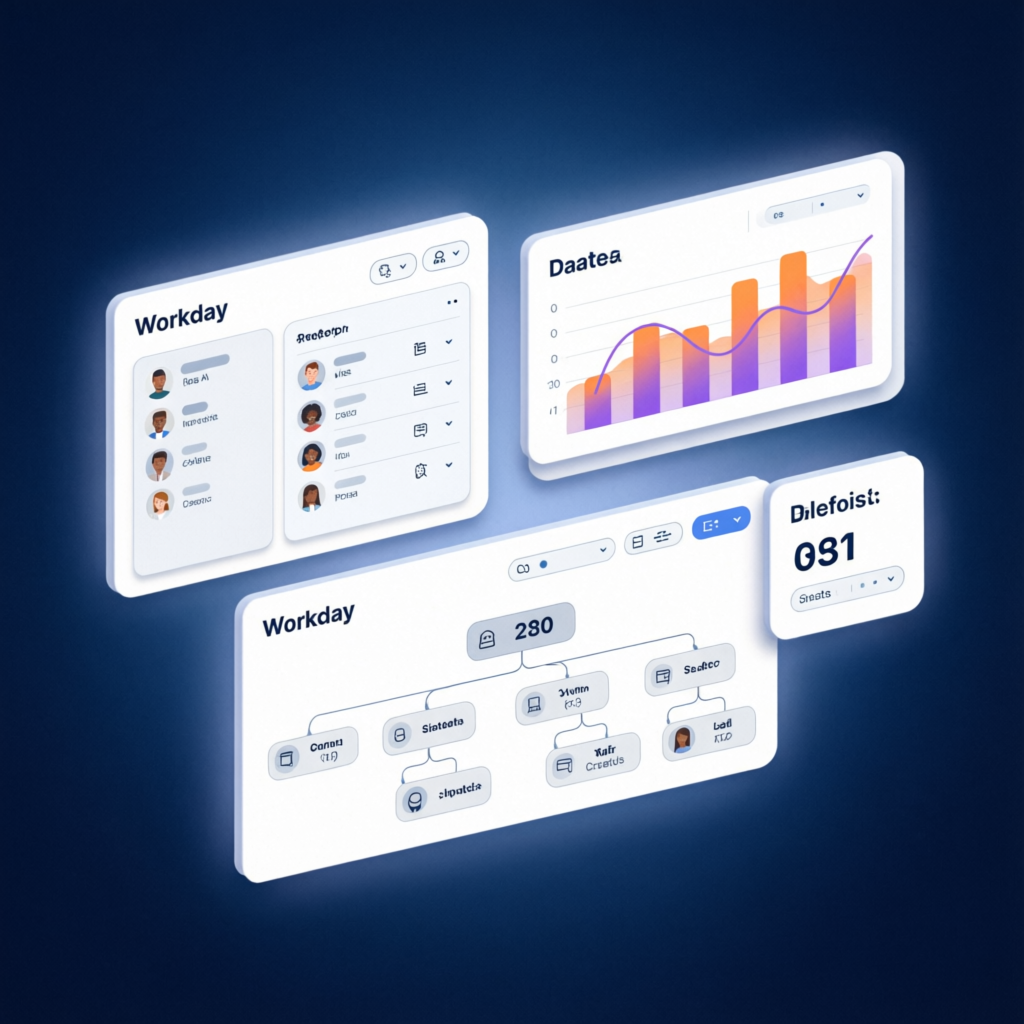
Build and manage end-to-end data pipelines in Workday Prism Analytics
Configure data sources and ingest datasets from multiple external systems
Apply transformations with joins, unions, aggregations and calculated fields
Create interactive discovery boards and dashboards for data visualization
Generate composite and advanced reports using Prism analytical datasets
Implement row-level and column-level security for Prism data sources
Course Curriculum
5h of self-paced, hands-on Prism Analytics training.
How This Tutorial Works
Start from scratch and master Prism Analytics fundamentals in two weeks.
Enroll & Get Credentials
Sign up free and receive your personal Workday tenant login by email within minutes.
Explore the Tenant
Take a guided tour of HCM modules, security roles and configuration screens.
Build Real Projects
Configure lifecycles, dashboards and benefits plans inside your own sandbox.
Certify & Get Placed
Earn your certificate and unlock resume reviews plus hiring partner referrals.
Hands-on Projects
Real tenant tasks that mirror actual Workday engagements.
Employee Lifecycle Config
Configure a complete employee lifecycle from hire to termination inside your tenant.
HR Metrics Dashboard
Build a custom dashboard for HR metrics and analytics using Workday report writer.
Benefits Plan Setup
Implement a benefits plan with eligibility rules, enrollment periods and dependents.
Recruitment Workflow
Create a recruitment workflow with job postings, candidate pipelines and offers.
Learn From a Certified Expert
A practitioner who has shipped Workday at Fortune 500 scale.

Sarah Mitchell
12+ years of Workday analytics and Prism implementation experience. Certified Workday HCM, Reporting and Prism Analytics professional who has built enterprise data pipelines for Fortune 100 companies.
Loved by 75,000+ Learners
Real outcomes from real students who took the leap.
"Tenant access changed everything for me. Instead of just watching videos, I was configuring business processes in a real environment. I landed a Workday consultant role within 3 months of finishing."

"I compared a lot of courses � this was the only one where I actually got my hands on a tenant. The projects mirror exactly what I do on client engagements now. Worth every minute."

"Sarah breaks down complex security and configuration topics so clearly. The dashboard project became my portfolio centerpiece in interviews � I got three offers in one month."

Frequently Asked Questions
Everything you need to know before enrolling.
Yes. Every enrolled student receives personal credentials to a live Workday training tenant. You'll log in, configure modules and complete graded tasks � exactly like a real implementation.
Absolutely. The course is currently sponsored as part of our scholarship program. You get full video access, tenant credentials, projects, certificate and mentor support at zero cost.
No prior experience required. The course starts from fundamentals and progressively builds to advanced configuration. HR, IT and career-switchers all thrive here.
You keep full tenant access throughout the 4-week program plus an additional 3 months after completion, so you can revisit configurations and continue practicing.
Yes � a verifiable certificate of completion issued by HCM Training Zone, shareable on LinkedIn and recognized by our hiring partners.
Lifetime mentor support via community channels, weekly live Q&A sessions with certified consultants, plus resume reviews and mock interviews for career-track students.